
Understanding aquifers
/Would it surprise you to know much of Lummi Island was covered by seawater following the last ice age about 10,000 years ago? That’s a blink of an eye in geologic time. As glaciers melted from the last ice age, sea level rose, but the land also rose at a faster pace as the massive weight was lifted from above.
This second installment of Water Watchers sets the stage for how our ground water is dispersed below our feet, which is a real jigsaw puzzle that geologists have tried to piece together. Accurately understanding where our drinking water comes from will help us prepare for dealing with changing climates and population growth in future years.
A tale of two islands

A seismic fault line running roughly along Sunrise Road separates Lummi Island into two distinct zones. South of the fault lies Lummi Mountain consisting mostly of exposed rock. Some wells have been drilled into this formation and some natural springs exist, but most water is obtained from surface runoff and captured in lakes such as in Scenic Estates.

Dickenson Lake at Lummi Island Scenic Estates, the only surface water system on the island.
North of the Sunrise Road fault there is a completely different story to be told, and one this article will focus on, which is where the rest of us get our water. The northern half of Lummi Island is characterized as flatter terrain of either underlying rock formations of greenstone between Sunrise and Legoe Bay, and sandstone north to Migley Point. Several hundred wells have been drilled into most of the northern half of Lummi Island, with about half being completed in the greenstone or sandstone formations.

This graphic from Bill Sullivan’s 2005 The Hydrogeology of North Lummi Island shows distinct boundaries of a dozen different aquifers, but the degree of how they interrelate to each other can be difficult to quantify.
The rest of the wells are drilled into glacial till. Lummi Island was once buried by mile-thick glaciers as recently as 11,700 years ago. As they moved and then melted over several thousand years, large glacial deposits of sand and gravel were left behind, and then buried again over the years. The wells in glacial till aquifers have a varying capacity to capture and retain fresh water. Some are interconnected to some degree. Mapping these aquifers is difficult given the limited well logs available to deduce what’s down there, according to a recent conversation with Bill Sullivan, now the owner of American Land and Water Consulting.
While this is an oversimplification of the geologic conditions and processes that led up to them, it is a fair presentation to begin to understand the complexities of knowing where your drinking water comes from. Aspect Consulting summed it up nicely in their 2006 report commissioned by Whatcom County Planning Department saying, “aquifers of Northern Lummi Island to be highly variable from place-to-place.”
Going underground
The question of how much water seeps into the ground adds to the uncertainty of how much water is stored below us. This is called infiltration and replenishes what is removed by well pumps or continues to flow to the sea, as is shown in the graphic below.
Glacial till deposits have lots of room for water relative to rock and sandstone layers which rely on cracks and fissures to retain water. The stone aquifers generally result in low yield wells unless a confined aquifer can be found. Many of these wells are also drilled to greater depths below sea level to find adequate volumes of water.
We touched on the ‘Water Cycle’ in the opening article, reporting that only about 6% of all rainfall finds its way into our aquifers to replace the water we use. So let’s explore how water finds its way there, and how it keeps the seawater—being heavier than fresh water—at bay.
When the rains come, the weather, intensity, time of year, vegetation, slope of the land, permeability of the landform all come into play on how much water can be absorbed into the ground. Intense rainstorms during the cold winter months means most of the water will runoff into the sea, with little being absorbed into an already saturated soil.
From forest to faucet
Trees are increasingly recognized for their importance in managing runoff. Their leaf canopies help reduce erosion caused by falling rain. The canopy also intercepts the rain, gradually releasing bouts of heavy rainfall into the soil below. Tree roots create channels through the soil, called macropores, that greatly increase the rate of infiltration. Learn more about the EPA’s recommendations here.
Conversely, during dry hot summers infrequent showers means that much more is evaporated or taken up by vegetation and trees, doing little more than wetting the surface. We receive about 33 inches of rain per year and about 6% of that makes it into the aquifers below us, a mere two inches per year.
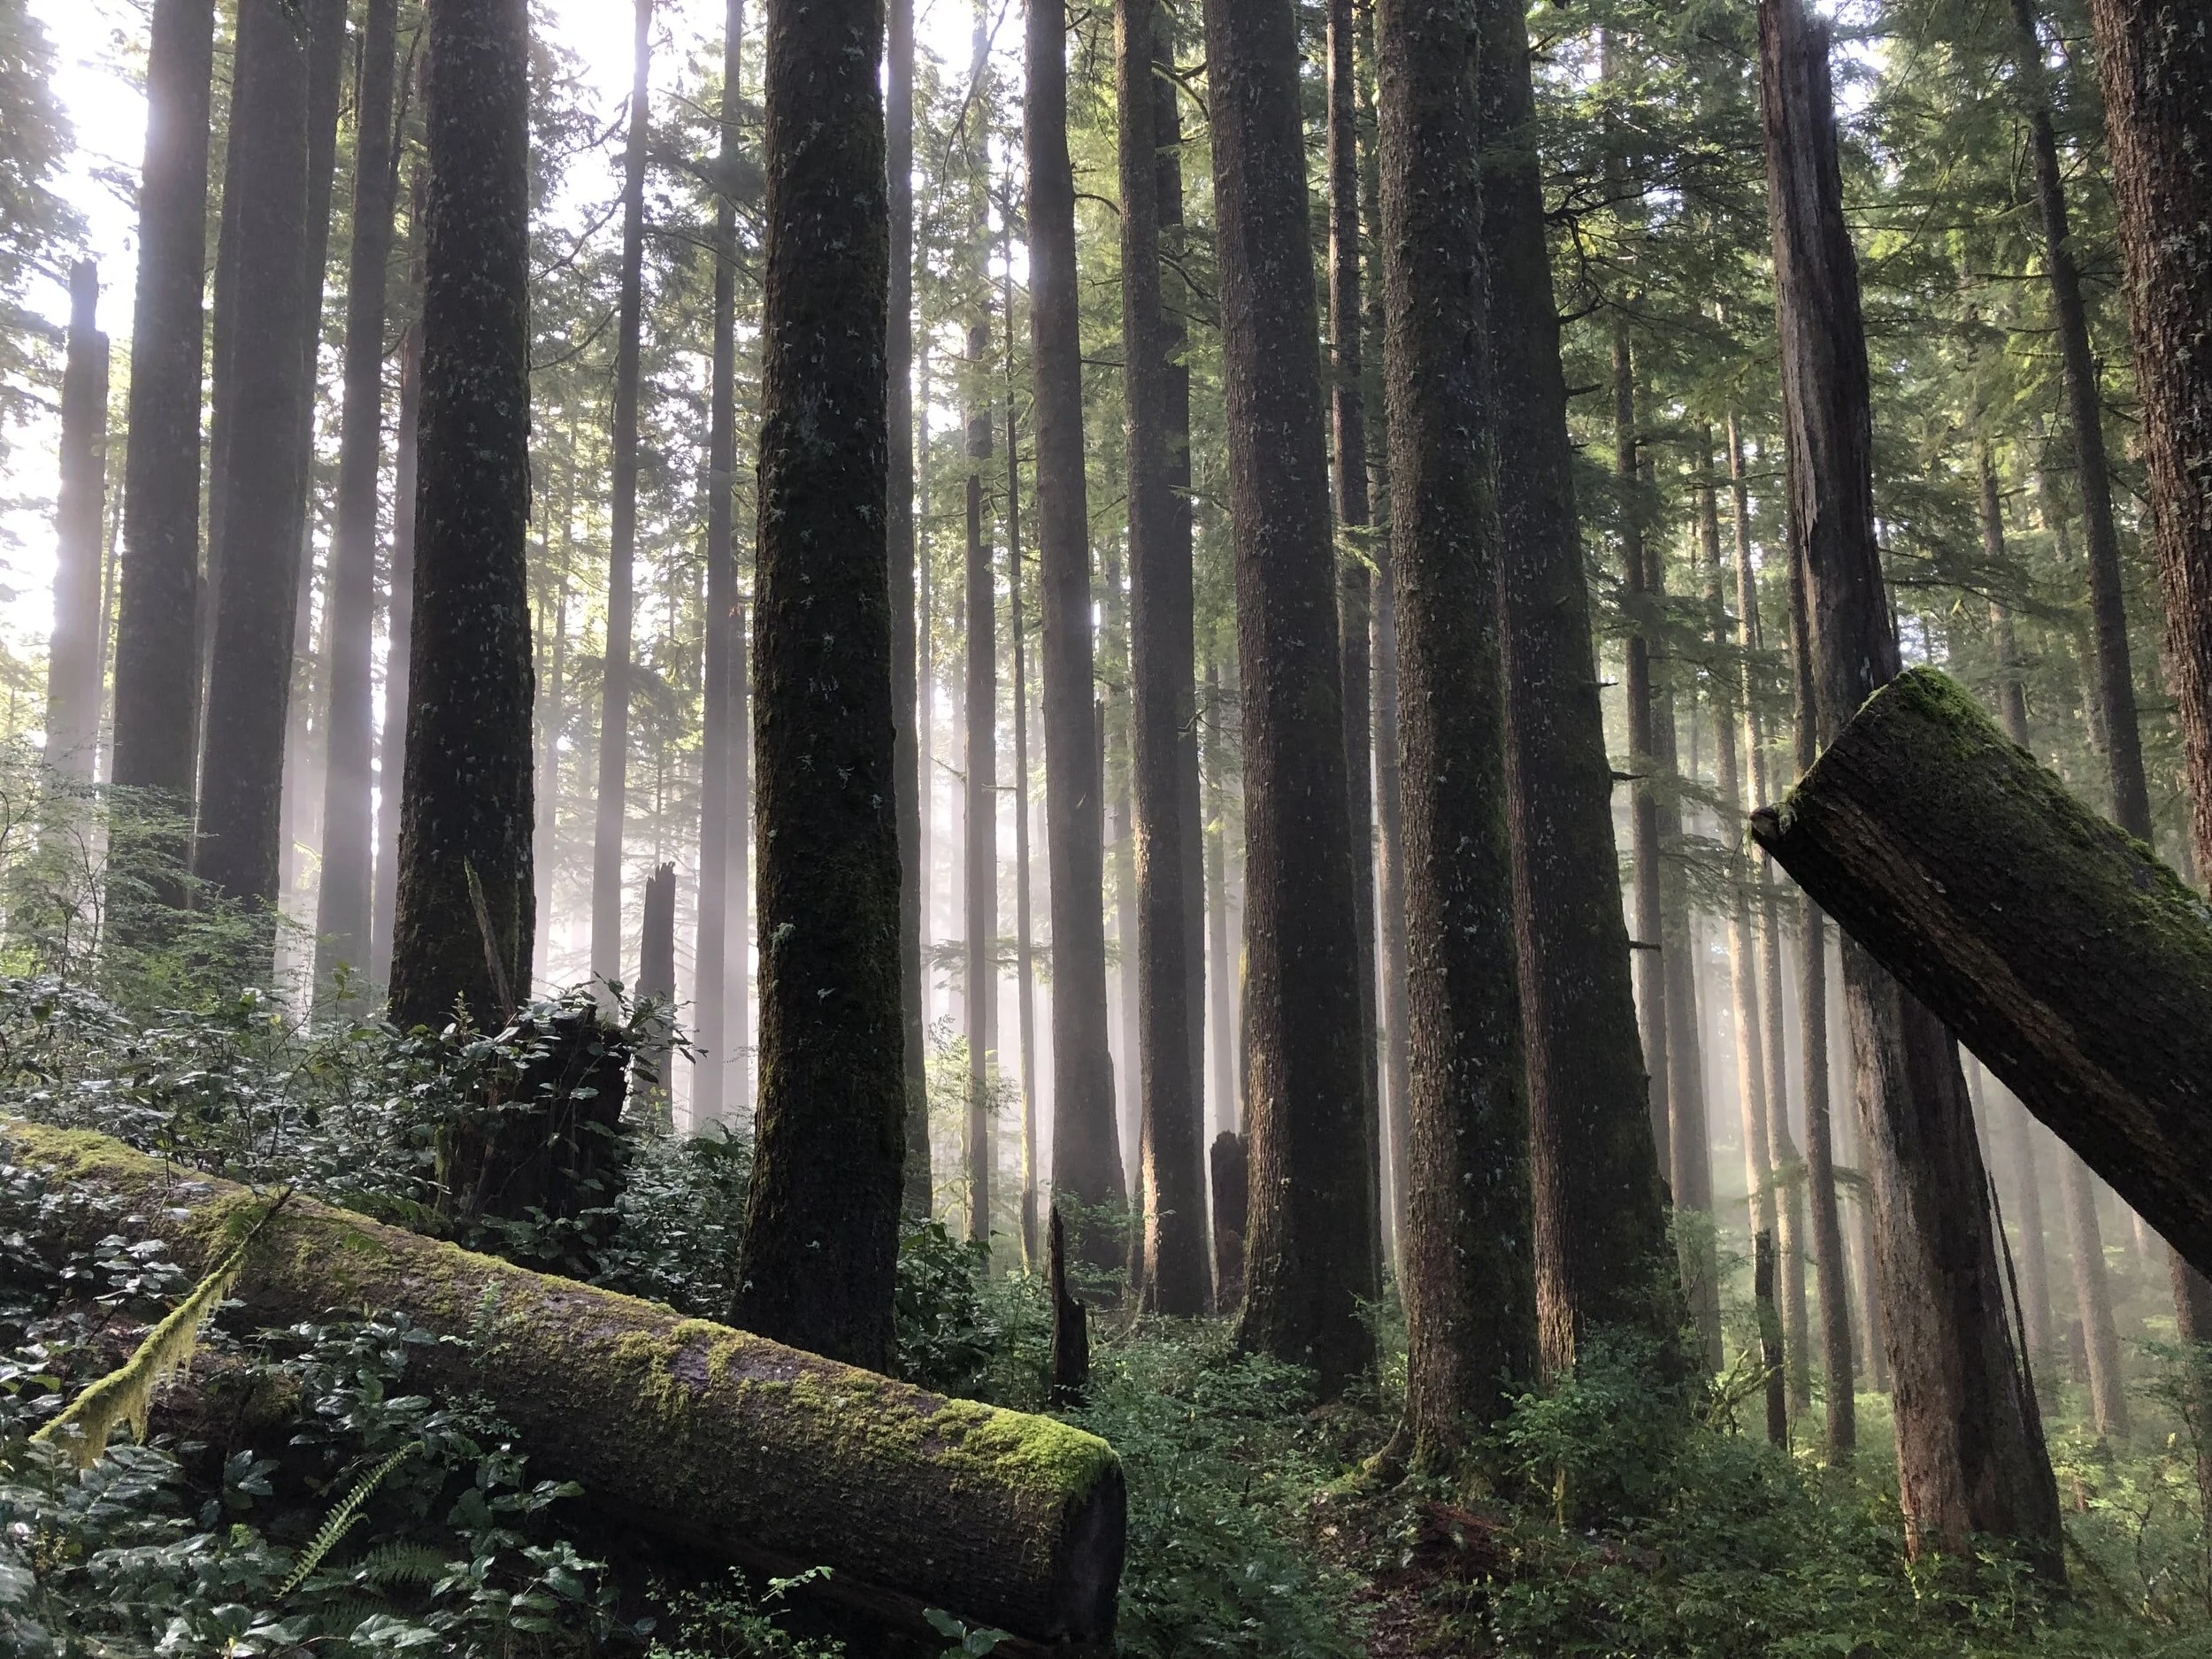
Like giant sponges
"Forests are like giant sponges on the landscape, soaking up precipitation through the year and slowly releasing that water to underground aquifers or to run off in streams. The deep organic layer of branches, twigs, needles and leaves in forests absorb precipitation and dramatically increases water infiltration and filtration, where it gradually flows downward through the soil to soak into our aquifers, or to run off in seasonal streams (important for water users on the south end of the island). Essentially, Lummi Island's forests and sustainable fresh water supplies are directly connected, from forest to faucet, which allows all of us to live.
"Forests on Lummi Island are enormously valuable for their many ecological, social, economic, and spiritual benefits. But one sometimes overlooked but critically important benefit is the impact of our forests on island aquifers which provide all our fresh water on this island.
"There is no better argument for retaining and enhancing our forests than the impacts they have on our fresh water resources."
Scott Josiah, PhD
Retired Nebraska state forester and director of the Nebraska Forest Service
Lummi Island FD Disaster Preparedness Division
Retaining water in wetlands, drainage ditches, small ponds or even rainwater catchment barrels means that more of it has a chance to percolate through the various layers of clays, silts, loams and rocks that show up on your well logs created when drilled. The role our wetlands play and efforts to let runoff soak in cannot be overstated.
The balance of fresh water and salt water
All aquifers on Lummi Island are closely surrounded by salt water. Fresh water is lighter than salt water and is constantly flowing through the ground towards the sea, which keeps the salt water at bay, literally.
As a general rule on aquifers near seawater shorelines, fresh water above sea level pushes seawater out and away from the higher terrain. Through this constant flow outwards and downwards, one foot of fresh water above sea level is able to displace about 40 feet of salt water below sea level in an aquifer. Careful measurements of wells near shorelines are able to estimate how much freshwater is below sea level. Island County does this to predict where brackish “mixing zones” are between the two water bodies.
Public information about your well
You can find information on your own well by going to an interactive map from the Department of Ecology’s Washington State Well Report Viewer.
On the other hand, Aspect Consulting found our situation much more complex, and found little relationship between where a well is dug or how deep it is when trying to predict where the sea/freshwater boundary resides. Aspect reported, “The data suggests a complex groundwater flow system where the location of freshwater/saltwater transition zone is strongly influenced by local variations in aquifer permeability and pumping.”
The buffer between fresh and sea water is dependent on many variables, and the transition area between the two isn’t so clear cut. There will be more about seawater intrusion in the next article.
Now, if we start changing things around, such as sea level rising by a foot or two in the coming decades, it is speculated we could lose 40-80 feet of our fresh water below sea level. In some aquifers, that’s getting close to the bottom of the barrel. Sea level is rising at nearly two inches each decade, while our island continues to rebound at less than ⅛ of an inch in the same period. Clearly, our island is going to get smaller as shorelines move inland, with less fresh water above sea level.
The cone of depression
Another way to disrupt the fresh/sea water balance is to over pump a well, causing a void in the freshwater beneath the well pipe, which could allow sea water to fill that void over time. This is called ‘Cone of Depression’.

Over pumping a well may cause nearby wells within the cone of depression to go dry, and draw salt water intrusion to the well.
Rising populations on a smaller land mass can only put more stress on our aquifers running near empty in some areas. If all dwellings currently built on the island became home to full time residents, our population could double in a short time. Building more homes is also allowed under current zoning, which could put us near triple our current population. All this can be accommodated if we have the will to monitor and manage our wells and groundwater aquifers in a cooperative manner by both water associations and private well owners. Sticking more straws in a milk shake does not mean more ice cream for all!
This short video from Soquel Water District in California explains what happens when your well pumps faster than the aquifer is recharged.
Pump rapidly enough and eventually you’ll be tasting brackish water. Once seawater intrudes in a well it’s very difficult to reverse the process. Drawing small gulps of water at low flows is generally preferable to pumping full tilt for hours to keep up with demand.
Put your well to the test
The Department of Ecology and Whatcom County require public water systems to test for chlorides present in the water supply as an indication that sea water intrusion is occurring, and to what degree. 99 ppm (parts per million) is the maximum before systems are required to take action, while 250 ppm is the maximum allowed by EPA and the State Dept of Health for drinking water. Seawater contains nearly 20,000 ppm by comparison. Certified labs in our area can do the tests for private well owners.
Laboratories in Whatcom County
Exact Scientific Services
1355 Pacific Place #101
Ferndale, WA 98248
(360) 733-1205
Edge Analytical Laboratories
805 W. Orchard Drive #4
Bellingham, WA 98225
(888) 725-1212
Need help or advice collecting samples for chloride and other contaminants on Lummi Island? The authors of this article are happy to help.
Some aquifers are found mostly above sea level or further inland where the influence of tides is not large. The 1994 Lummi Island Groundwater Study completed by Whatcom County found that tidal swings of 12 feet only raised or lowered static levels in shoreline wells by less than a foot, meaning the changes are gradual.
The next Water Watchers article will dive head first into Seawater Intrusion, showing where things stood in previous studies, and compare that with recent testing provided by our public water systems where available.
As aquifers vary widely around the island, we would be better served to try to understand which one we are in, how many wells are pumping water out, and ways to redirect more rainwater to replenish them.
How well is your well?
Aquifers are not created equally. Not only do we have to protect from allowing sea water to displace our fresh water, we have to contend with naturally occurring contaminants, such as arsenic, iron, and manganese. If that weren’t enough to deal with, add in the stuff we are sending down such as nitrates from septic systems or other pollutants and it can become a witches brew if we let our guard down. Our aquifers are manageable, but should not to be taken for granted as in “free and forever”.
Measure your well level on a regular basis
Doing so will allow you to identify and diagnose well-production issues long before they cause serious problems such as water outages and pump damage.
Washington state requires Group A water systems (more than 14 connections) to measure seasonal variances in static well levels as a means to “document the continuing availability of the source to meet projected long-term demands.” (WAC 246-290-415-10). This is generally done in April and August of each year when testing for chloride levels.
Local health codes require adequacy of water supply for new construction, which may require a well inspection as part of the permitting process.
Just as we depend on our fuel or battery gauge in cars to avoid long walks to the service station, knowing when the supply is getting low is always a good thing. More investigation and monitoring of well level and sea level future conditions would be wise. Time and tide wait for no man!
Co-Authors
Mike Skehan | email
MANAGER OF RIDGE WATER ASSN, PAST OWNER OF LUMMI WATER WORKS, MGR OF HILLTOP WATER AND SUNSET BEACH WATER, (WATER DISTRIBUTION SPECIALIST, BASIC TREATMENT OPERATOR), RETIRED.
Isaac Colgan | email
WATER TREATMENT PLANT OPERATOR LEVEL 2 AND WATER DISTRIBUTION MANAGER LEVEL 2 FOR , Isle-Aire Beach Association, OWNERS ASSOCIATION OF BEACH CLUB CONDOS, Marine View Estates, SEACREST WATER ASSOCIATION, Salvation Army Camp Lummi, and previously for LUMMI ISLAND SCENIC ESTATES.
Understanding where our water comes from and how we get it is vital to how we as citizens decide how to protect or squander it for future generations to come. Much of these articles derive from efforts completed by a group of dedicated islanders in the late 1980s, known as the “Water Watchers”. Prior to that, other islanders participated in Comprehensive Planning efforts in the 1970s, and a series of articles in the Tome in 1992 (Sue Blake and the Whatcom County Dept. of Health) which all culminated in three major water studies in 1994 (Lummi Island Groundwater Study), 2005 (Bill Sullivan, Aquifers of Lummi Island, Master Thesis), and finally in 2006 (Hydrogeologic Investigation, Whatcom County Planning and Aspect Consulting).
Our acknowledgement and gratitude go out to all those that have participated in understanding how our water comes to us on this nine square mile island we call home.
Resources referenced in this article


